
WCC President Rose Bellanca’s arrival on campus in 2011 triggered an enormous, uncontrolled expansion of the College administration. Examining WCC’s’ administrative growth in the context of time gives new insight into its impact on Washtenaw County taxpayers and WCC’s students.
The College draws its operating funds from a variety of sources, but its three largest revenue sources are:
- Washtenaw County taxpayers
- The state appropriation
- Student tuition and fees
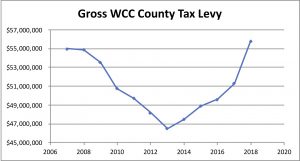
WCC’s tax collections 2008-2018
This chart shows the County’s tax levy from 2007 to 2018. The drop in tax revenues between 2008 and 2013 represents declining Washtenaw County property values. Beginning in 2014, tax revenues in Washtenaw County began to increase again.
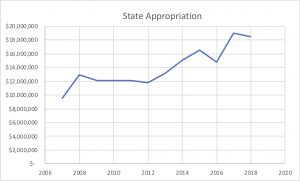
WCC’s state appropriations 2008-2018
This chart shows the State appropriation – money given to WCC by the State of Michigan – between 2008 and 2018. The data show that the State appropriation increased or remained flat in all but three years.
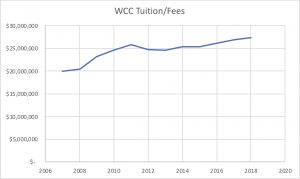
WCC’s student tuition and fees 2008-2018
This chart shows the student tuition and fees collected by WCC between 2008-2018. The data show that student tuition and fees dropped as the College enrollment dropped – until 2013. Beginning in 2014, the amount of tuition and fees the College collected from student rose, even though both the number of students enrolled and their number of credit hours dropped.
WCC’s combined major revenue picture 2008-2018
The chart below shows the effect of all major funding sources on WCC’s operating revenues from 2007-2018. At the beginning of the Great Recession, WCC’s revenues actually increased, even though county tax collections started to drop. This is because WCC’s enrollment increases produced more than four times more in new tuition and fees than the College lost from decreases in tax collections. At the same time, the State increased WCC’s appropriation.
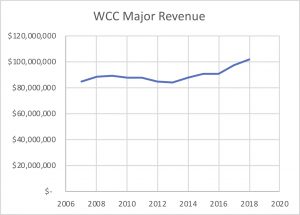
Enrollment increases drove WCC’s revenues higher each year until 2010. (The recession technically ended in 2009.) In FY2010, WCC tuition and fees increased, but they did not fully offset the decline in property tax revenues. WCC finally felt the financial impact of the recession for the first time in 2010.
In FY2011, tuition and fee increases offset the drop in property tax collections as enrollment dropped. In FY2012, the College saw a drop in all three funding sources. When WCC’s revenues were at their lowest point, the Board of Trustees hired Rose Bellanca to lead WCC.
WCC’s administrative growth
Comparing WCC’s administrative growth with the changes in the College’s primary revenue sources shows the administration’s disregard for the county’s financial circumstances. Declines in revenue are shown in parentheses.
| Year | Positions | Taxes | State | Tuition |
|---|---|---|---|---|
| 2012 | 5 | $(1,529,151) | ($322,000) | ($1,079,659) |
| 2013 | 18 | $(1,681,230) | $1,266,000 | $(66,000) |
| 2014 | 1 | $969,245 | $2,046,000 | $706,000 |
| 2015 | 4 | $1,446,710 | $1,406,000 | $70,000 |
| 2016 | 7 | $682,185 | $(1,711,000) | $753,000 |
| 2017 | 3 | $1,676,220 | $4,133,000 | $638,000 |
| 2018 | 13 | $4,547,489 | $(510,000) | $570,000 |
In 2012 and 2013, when the College’s revenues were declining, the President added 23 administrators to WCC’s payroll. During the same period, the number of employees in WCC’s other major employee groups dropped by 13.
Beginning in 2014, revenues from student tuition and fees began to rise, even as WCC’s enrollment numbers dropped. These increases helped finance the addition of more administrative positions. From 2016-2018, revenues from tuition and fees rose by $1.96M, and the size of the administration grew by 23 more positions.
Funding WCC’s administrative growth
WCC’s Fall enrollment has declined nearly 12% during Rose Bellanca’s tenure. Fall credit hours have dropped nearly 5%, but since 2014, tuition and fees revenue has steadily increased. This means that fewer students are paying more to attend WCC.
By itself, the decline in Fall enrollment isn’t an indictment of WCC’s current administration. It likely means that fewer people are enrolling in WCC classes because they’re working. It may also mean that local families are more financially stable, and can better afford four-year universities. Of more concern is the five-year trend of raising tuition and fees for WCC students.
These increases come at a time when Washtenaw County tax revenues and the state appropriation are both rising. In 2018, WCC’s county tax revenues exceeded $55M for the first time since 2007. As a result, WCC received about $5M more from county taxpayers in 2018. Regardless of the recovery, WCC collected more than a half-million dollars in tuition and fees, even though the number of Fall 2018 students and the number of credit hours they enrolled in both dropped.
Since 1966, Washtenaw County taxpayers have generously ensured that WCC has sufficient operating resources. WCC students are often among Washtenaw County’s most economically marginalized residents. For them, paying WCC’s seemingly modest tuition can and does hurt. Collectively, we have not made these sacrifices to fund a massive increase the size of the College administration.
Like every other employer, WCC has certainly encountered rising administrative costs for salaries, benefits and pension/retirements. In WCC’s case, that does not justify raising tuition and fees, but it does provide an undisputable reason for tightly restricting WCC’s administrative growth.
Photo Credit: 401(k) 2012